Module # 10 assignment
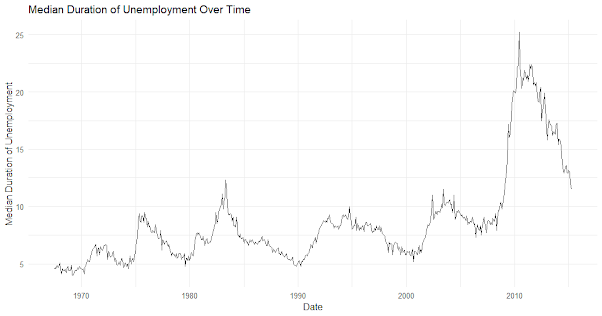
Time series data is important in many fields, such as finance, economics, and weather forecasting. It is defined as observations taken at repeated time intervals. Finding patterns, drawing conclusions, and coming to wise decisions all depend on the visualization of such data. First, we take a look at the 'economics' dataset that is integrated into ggplot2, which includes economic indicators for a number of years. This dataset contains variables like population, unemployment rate, and median length of unemployed. Using a time series graphic of the unemployment rate, we first investigate patterns and variations in the dataset.

By charting the median length of unemployment across time, we can see possible long-term trends or seasonal patterns. Furthermore, we explore combination visualization methods, comparing and contrasting several time series plots for investigation of correlation or comparability. The flexible framework of ggplot2 allows analysts and researchers to obtain deeper insights into the dynamics of time-dependent phenomena, which improves forecasting and decision-making in a variety of disciplines.

These visualizations enable audiences to confidently and clearly navigate complicated temporal environments by revealing the underlying narratives hidden behind time series data.

No comments:
Post a Comment